What is a liquidation map? How to read it
· 2:09
· 2:09
What is a liquidation map? How to read it · 2:09
In this video
A liquidation map, or liquidation heatmap, shows the prices where leveraged positions in crypto perpetual futures would be closed by force. The brighter the band or the longer the bar, the more positions sit at that price. Price often moves toward these levels: each liquidation is a forced market order, and a cluster of them can push a move further.
What is a liquidation?
With leverage, your collateral covers only part of the position. In the video (0:05) a trader opens a 10× long on BTC at 65,000 with $100, so the position is worth $1,000. Every 1% the price falls takes about $10 of that $100.
When what is left drops to the maintenance margin, the exchange closes the position. On NeutronX the maintenance margin for BTC is 0.5%, so this long is liquidated near 58,800, about 9.5% below the entry. A 10× short from 65,000 is liquidated near 71,200, 9.5% above it.
The distance to liquidation is roughly 1 divided by the leverage, minus the maintenance margin. At 25× it is about 3.5%, at 50× about 1.5%, at 100× about 0.5% (0:24). Longs are liquidated below the price, shorts above. The exact rules on NeutronX are in Liquidations.
Why exchanges don't publish liquidation levels
No exchange shows where its traders would be liquidated. Binance, OKX and Bybit publish open interest, the total size of open positions, but not who holds them, at what entry or with what leverage. So most liquidation maps you find online are estimates built from open interest and assumed leverage. The NeutronX map has one too, and next to it a layer of real positions from Hyperliquid, where account data is public.
How the heatmap is built
The Heatmap layer reads Binance's open interest in 5-minute steps over the last two days. When open interest rises in a 5-minute bar, the map counts it as new longs and shorts opened at that bar's typical price.
For each of them it places levels for 25×, 50× and 100× leverage, as far as the coin allows. Leverage limits come from Bybit's public risk table, because Binance only gives its own with an API key. If a coin's limits are unknown, the map says "Leverage approx." and its prices are rougher.
A level stays on the map until the mark price touches it, then it disappears.
Brightness is strength from 0 to 100, compared with the strongest cell on screen. It is not dollars. At 1:32 in the video a band at 66,500–66,550 has strength 18 of 100. The model can't know real leverage, cross margin or who has already closed, so the heatmap never shows amounts.
Real liquidation levels: Hyperliquid positions
Hyperliquid is the one big perp exchange whose positions are public. For any account it reports open positions and the liquidation price the exchange itself calculates, cross margin included. The Hyperliquid positions layer reads these accounts and shows dollars at each price, within ±5% to ±100% of the current price. The candles stay on the left, so you see where the price is now.
In the video (1:11), $56.5M of shorts would be liquidated at 74,700–74,900, which is 15.2% above the price. The line is a running total: if BTC fell to 55,000, $318.6M of longs would be wiped out along the way (1:16).
There is no list of all Hyperliquid accounts, so the map reads only part of the market. The caption says how much and how fresh: in the video, "Read 43% of the market, data ~66 min old". A position whose liquidation price the mark has already passed is left out, because it is either closed or stale. And Hyperliquid is one exchange: it tells you nothing about traders on Binance.
Live liquidations from Binance, OKX and Bybit
On the heatmap, the Liquidations layer puts real liquidations on the candles as dots, for the last two days. You pick the exchange, Binance, OKX or Bybit, and the map shows its candles and its liquidations. A bigger dot means a bigger liquidation. This is how you see price sweep a level: dots show up where a bright band ends.
These feeds are samples, not totals. Binance sends at most one liquidation per market per second, the newest one, so most of a cascade never reaches the feed. Use the dots to see where liquidations happened, not to add them up.
How to read a liquidation heatmap
Brightness compares levels with each other and nothing more. Three situations come up most often.
A strong level close to the price. Under the heatmap the map lists the nearest strong levels. At 1:35 in the video they are shorts at 65,650 (+1.1%) and longs at 63,850 (−1.7%). Price often reaches a level this close, and the move can speed up as positions get closed.
Strong levels on both sides. Price may sweep one side and then the other. The map doesn't tell you which comes first.
Price took a level and came back. Once the forced orders have fired, the fuel for the move is spent. A turn right after a sweep is common.
Check how much the map is worth for your coin. The accuracy board (1:39) counts real liquidations on Binance, OKX and Bybit and shows how many had a map level within ±0.25%, ±0.5% or ±1%. Next to it is a control map: the same model built from open interest shifted by two days. In the video, on BTC and Binance, the map hit 74% and the control 71%, and the board says it plainly: no clear edge. When the two numbers are that close, rely more on the Hyperliquid layer.
How to open the liquidation map on NeutronX
The video was recorded on the previous version of the map. There the layers were called Estimate and Real, and the heatmap had 1D to 30D periods. The steps below are for the current version.
Open Trading and pick a market, for example BTC/USDC.
Click the Liquidation map icon in the chart header, next to the TradingView and Clusters icons (0:57 in the video). The first time you open a coin, the map takes up to about 3 seconds to build.
Pick the layer with the two icons at the start of the map's toolbar: Heatmap or Hyperliquid positions. Red is shorts above the price, green is longs below it.
On Hyperliquid positions, set the range from the price: ±5%, ±10%, ±20%, ±50% or ±100%. Hover over a bar to see how much would be liquidated there and the total up to that price.
On the Heatmap, pick the candles: 1m, 5m, 15m, 30m or 1h. The map always covers the last two days. Hover over a band to see its strength.
Pick the exchange whose candles and liquidations you want to see: Binance, OKX or Bybit. Turn on Liquidations for the dots and Accuracy for the board.
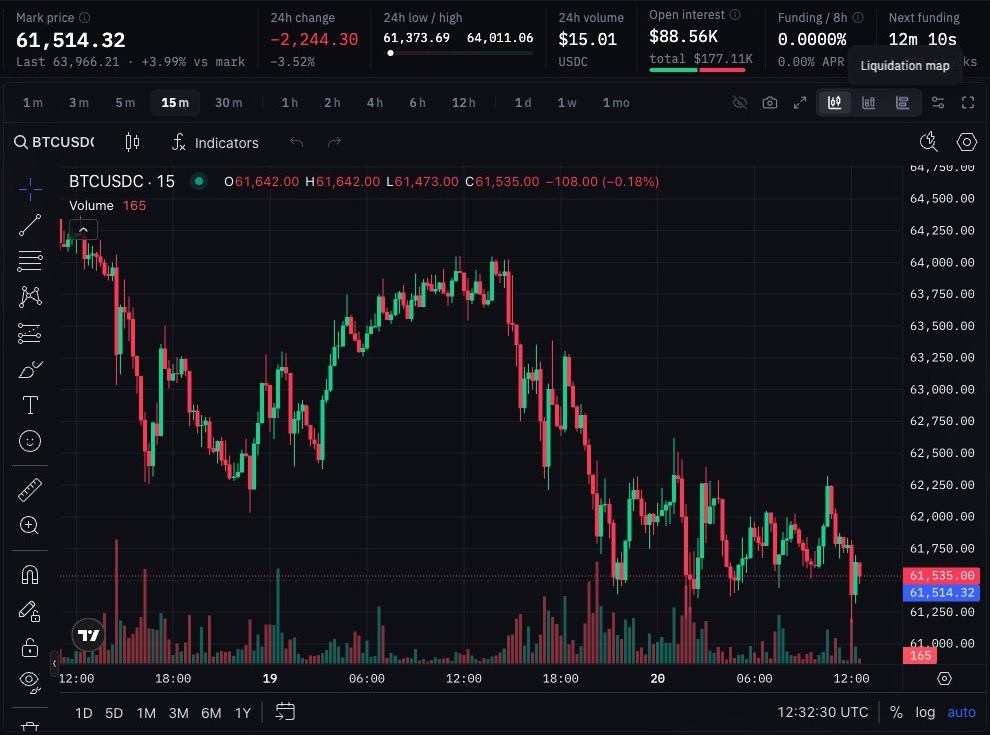
Step 2: the Liquidation map icon in the chart header on the NeutronX BTC/USDC page
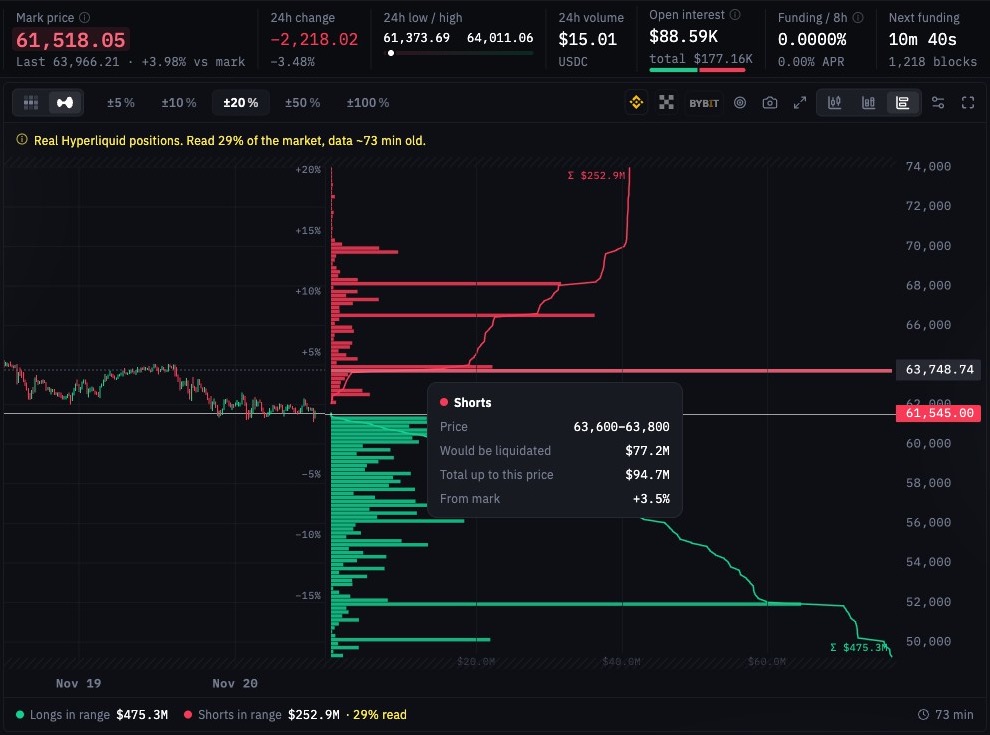
Step 4: Hyperliquid positions within ±20% of the price, with $77.2M of shorts to be liquidated at 63,600–63,800
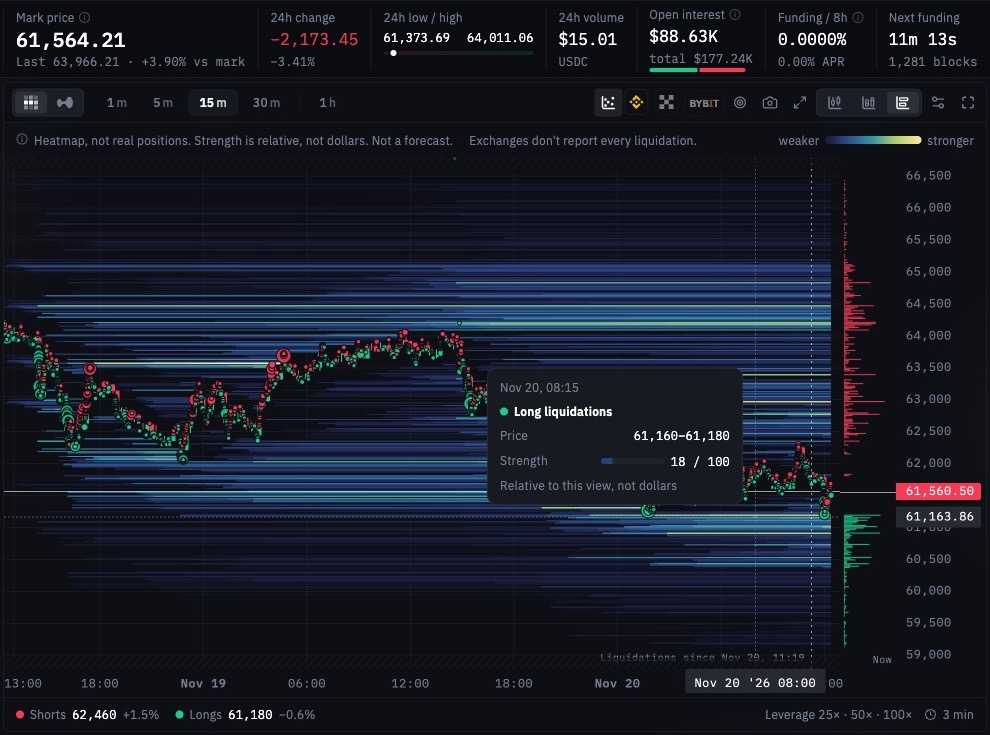
Step 5: the two-day heatmap on 15-minute candles, with Binance liquidations as dots and the strength of a band
Tip
A bright level close to the price is a frequent target. Set your take-profit just before it, not inside it, as the video suggests at 1:49.
Good to know
The map shows other exchanges' traders. The heatmap comes from Binance open interest and the real layer from Hyperliquid accounts. Positions on NeutronX are not on it, and NeutronX itself allows up to 10× leverage.
The heatmap runs a few minutes late. Binance publishes open interest 1.5–3 minutes after each bar closes. A new level can appear up to about 8 minutes after the positions were opened.
The real layer is partial and can be an hour old. A cross-margin liquidation price moves with the rest of the account between reads. Check the age in the caption.
Not every coin has both layers. Coins Hyperliquid doesn't list have no real layer, and coins Binance doesn't list have no heatmap.
Risk
A liquidation map is a guide, not a forecast. Price can ignore a level, or sweep it in a wick that takes your stop on the way. Don't put a stop-loss inside a strong level; put it beyond the cluster. If your own liquidation price sits inside a bright zone, lower the leverage or add margin.
FAQ
What is a liquidation heatmap?
It is a chart of the prices where leveraged positions would be force-closed, with brighter bands where more positions would go. On NeutronX the heatmap is an estimate built from Binance open interest over the last two days.
Are liquidation maps accurate?
Estimated maps are rough, because no exchange publishes real leverage or entries. The NeutronX map checks itself against real liquidations and a control map, and it often shows no clear edge. The Hyperliquid layer is exact for the positions it has read, but it covers only part of one exchange.
Does price always go to liquidation levels?
No. Price often moves toward big clusters, because forced orders add fuel to a move, but many levels are never reached. Treat a level as a place where the move may speed up, not as a target.
What's the difference between estimated and real liquidation levels?
Estimated levels are calculated from open interest and assumed leverage, so they show relative strength, not dollars. Real levels come from actual Hyperliquid accounts with the liquidation price the exchange reports, so they show dollars at each price.
Try the liquidation map on NeutronX
exchange.neutronx.com/trading